High School Maths Examples and Questions

to top menu   
go backback
   
to searchsearch
   to Statistics   

Answers − Scatter Diagrams

For each question plot a Scatter Diagram onto some graph paper and enter the correlation below

1. What type of correlation is there?
 
Height m 1 2 3 4 5 6
Weight kg 7 8 9 10 11 14


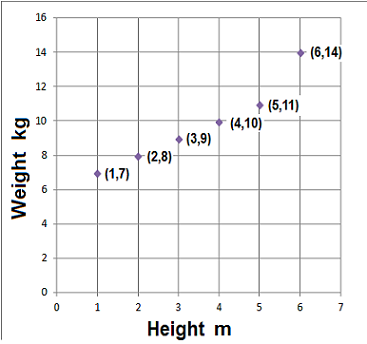
    There is a Postive Correlation


2. What type of correlation is there?
 
Month Dec Jan Feb Mar Apr
Coats sold 000s 9 9 7 3 2


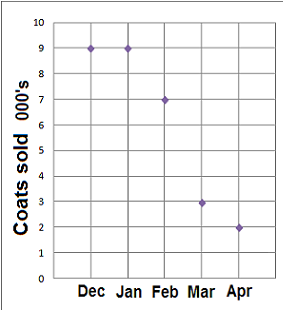
    There is a Negative Correlation


3. What type of correlation is there?
 
Distance to work km 1 2 3 4 5 6
Wages £000s 44 55 31 25 32 21


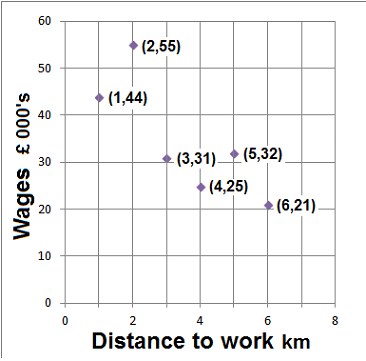
    There is No Correlation


to top menu   
go backback
   
to searchsearch
   back to:   examples    questions