

Scatter Diagrams and Line of Best Fit
We already know about Scatter Diagrams (refer to Scatter Diagrams)
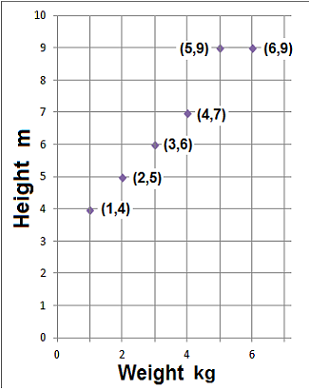
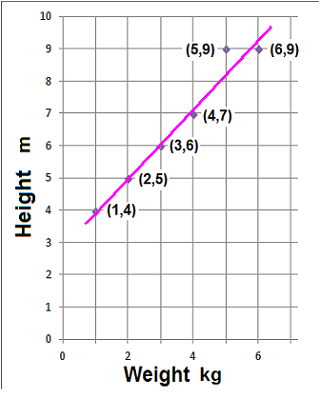
After plotting the scatter diagram, a line of best fit can be drawn through the data
Use the line of best fit to estimate the value of one variable when the other is given.
- Example 1. (a) Draw the line of best fit
(b) Estimate the weight when the height is 8 metres. - Example 2. (a) Draw the line of best fit
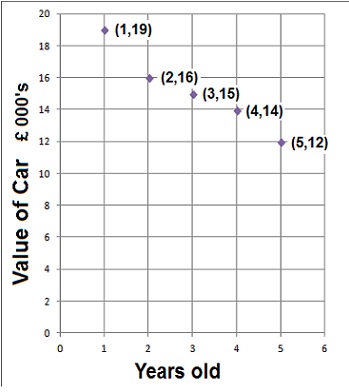
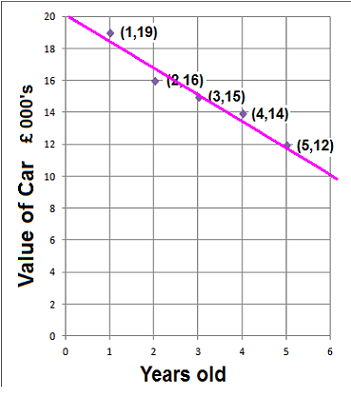
(b) Estimate the value of the car when it is 6 years old.
| (a) | The line of best fit is |
| (b) | Draw a line across where the weight is 8 metres, and then when it hits the line of best fit, draw a line down to estimate the weight. |
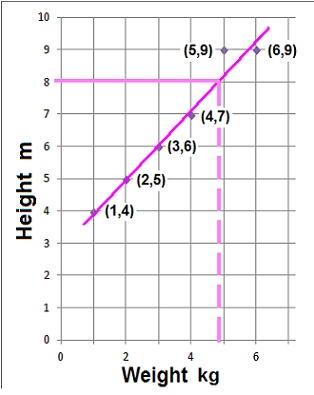
The weight is about 4.8 kg
| (a) | The line of best fit is |
| (b) | From year 6 draw a line up to the line of best fit. Then from the line of best fit draw a line across to estimate the value of the car. |
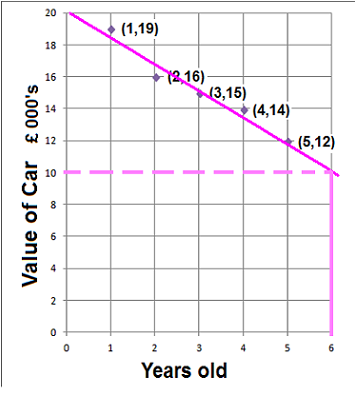
The value of the car is around £10,000