
Pie Charts
Pie charts are circles split into sections
To draw a pie chart:
| (a) | Find the total frequency |
| (b) | Find the angle of one frequency: |
| 360 degrees/total frequency | |
| (c) | Find the degrees of each section: |
| angle of one frequency × no of items in one section | |
| (d) | Draw the pie chart |
- Example 1. Draw a Pie Chart of the number of cakes sold
| Cake | Frequency f |
| Chocolate Cake | 24 |
| Coffee & Walnut | 22 |
| Carrot Cake | 14 |
| Victoria Sponge | 30 |
(a) Add up the frequencies to work out the total
| Cake | Frequency f |
| Chocolate Cake | 24 |
| Coffee & Walnut | 22 |
| Carrot Cake | 14 |
| Victoria Sponge | 30 |
| Total | 90 |
(b) Find the angle of one cake:
Angle of one cake sold: 360 degrees / total frequency
Angle of one cake: 360/90 = 4
(c) Find the degrees of each section:
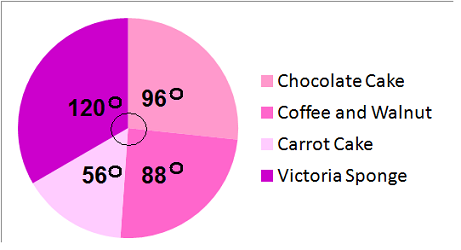
| Cake | f | angle for each section |
| Chocolate Cake | 24 | 24 × 4 = 96 |
| Coffee & Walnut | 22 | 22 × 4 = 88 |
| Carrot Cake | 14 | 14 × 4 = 56 |
| Victoria Sponge | 30 | 30 × 4 = 120 |
| Total | 90 | 90 × 4 = 360 |
(d) Draw the Pie Chart: