
Answers − Straight Line Graphs
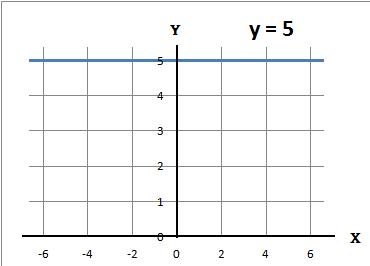
1. Plot the graph y = 5
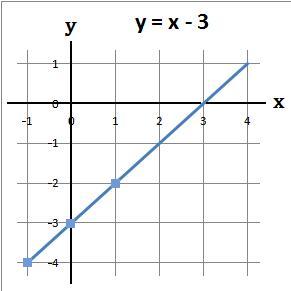
2. Plot the graph y = x − 3
(a) Using a table work out the values of y
|
(b) The coordinates of the above are (−1, −4) (0, −3) and (1, −2)
(c) Plot the above coordinates and draw a line through these points
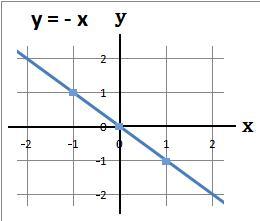
3. Plot the graph y = −x
(a) Using a table work out the values of y
|
(b) The coordinates of the above are (−1, 1) (0, 0) and (1, −1)
(c) Plot the above coordinates and draw a line through these points
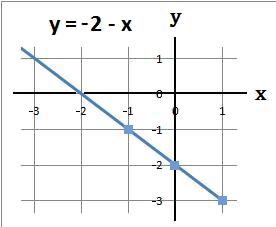
4. Plot the graph y = −2 − x
(a) Using a table work out the values of y
|
(b) The coordinates of the above are (−1, −1) (0, −2) and (1, −3)
(c) Plot the above coordinates and draw a line through these points
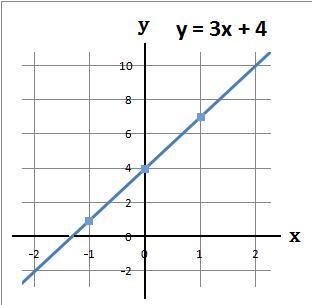
5. Plot the graph y = 3x + 4
(a) Using a table work out the values of y
|
(b) The coordinates of the above are (−1, 1) (0, 4) and (1, 7)
(c) Plot the above coordinates and draw a line through these points
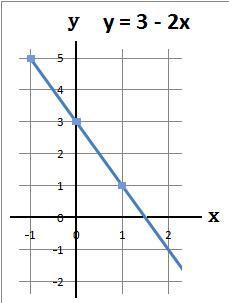
6. Plot the graph y = 3 − 2x
(a) Using a table work out the values of y
|
(b) The coordinates of the above are (−1, 5) (0, 3) and (1, 1)
(c) Plot the above coordinates and draw a line through these points
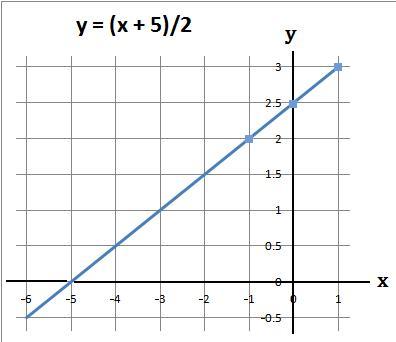
7. Plot the graph 2y − x = 5
(a) Make y the subject
| 2y | − | x | = | + | 5 | |||||
| + | x | = | + | x | note (1) |
| 2y | = | x | + | 5 | |||||
| ÷ | 2 | = | ÷ | 2 | note (2) |
| y | = | (x + 5)/2 |
Note: (1) add x to both sides
Note: (2) divide both sides by 2
(b) Using a table work out the values of y
|
(c) The coordinates of the above are (−1, 2) (0, 2.5) and (1, 3)
(d) Plot the above coordinates and draw a line through these points