

Answers − Plotting Quadratic Graphs 1
Enter the y values below and then plot onto graph paper
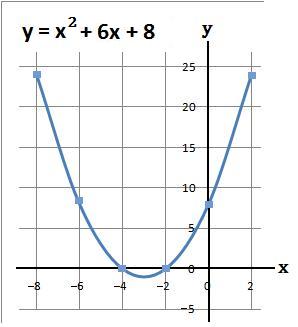
1. For the graph y = x2 + 6x + 8 when x = −8, −4 and 0. There are also the coordinates (−6, 8), (−2, 0) and (2, 24)
| | (a) Using a table work out the values of y |
y = x2 + 6x + 8
| | | x | −8 | −4 | 0 | | x2 | 64 | 16 | 0 | | +6x | −48 | −24 | 0 | | +8 | +8 | +8 | +8 | | y | 24 | 0 | 8 |
|
| | (b) The coordinates of the above are (−8, 24), (−6, 8), (−4, 0), (−2, 0), (0, 8) and (2, 24) |
| | (c) Plot the above coordinates and draw a line through these points |
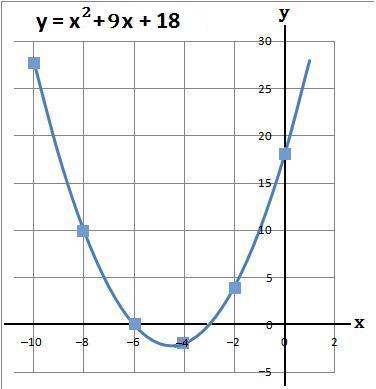
2. For the graph y = x2 + 9x + 18 when x = −10, −6 and −2. There are also the coordinates (−8, 10), (−4, −2) and (0, 18)
| | (a) Using a table work out the values of y |
y = x2 + 9x + 18
| | | x | −10 | −6 | −2 | | x2 | 100 | 36 | 4 | | +9x | −90 | −54 | −18 | | +18 | +18 | +18 | +18 | | y | 28 | 0 | 4 |
|
| | (b) The coordinates of the above are (−10, 28), (−8, 10), (−6, 0), (−4, −2), (−2, 4) and (0, 18) |
| | (c) Plot the above coordinates and draw a line through these points |
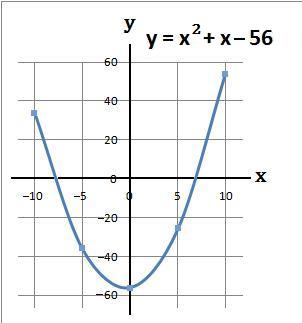
3. For the graph y = x2 + x − 56 when x = −10, 0 and 10. There are also the coordinates (−5, −36) and (5, −26)
| | (a) Using a table work out the values of y |
y = x2 + x − 56
| | | x | −10 | 0 | 10 | | x2 | 100 | 0 | 100 | | +x | −10 | 0 | +10 | | −56 | − 56 | − 56 | − 56 | | y | 34 | −56 | 54 |
|
| | (b) The coordinates of the above are (−10, 34), (−5, −36), (0, −56), (5, −26) and (10, 54) |
| | (c) Plot the above coordinates and draw a line through these points |
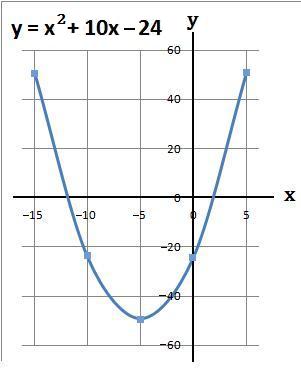
4. For the graph y = x2 + 10x − 24 when x = −15, −5 and 0. There are also the coordinates (−10, −24) and (0, −24)
| | (a) Using a table work out the values of y |
y = x2 + 10x − 24
| | | x | −15 | −5 | 5 | | x2 | 225 | 25 | 25 | | +10x | −150 | −50 | +50 | | −24 | −24 | −24 | −24 | | y | 51 | −49 | 51 |
|
| | (b) The coordinates of the above are (−15, 51), (−10, −24), (−5, −49), (0, −24) and (5, 51) |
| | (c) Plot the above coordinates and draw a line through these points |
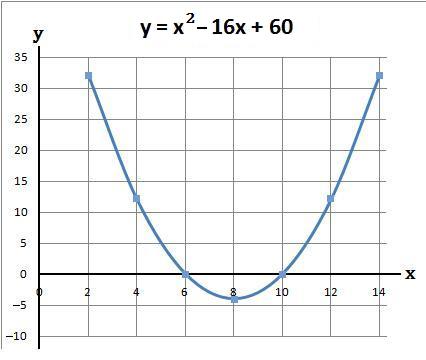
5. For the graph y = x2 − 16x + 60 when x = 2, 8, and 14. There are also the coordinates (4, 12), (6, 0), (10, 0) and (12, 12)
| | (a) Using a table work out the values of y |
y = x2 − 16x + 60
| | | x | 2 | 8 | 14 | | x2 | 4 | 64 | 196 | | −16x | −32 | −128 | −224 | | +60 | +60 | +60 | +60 | | y | 32 | −4 | 32 |
|
| | (b) The coordinates of the above are (2, 32), (4, 12), (6, 0), (8, −4), (10, 0), (12, 12) and (14, 32) |
| | (c) Plot the above coordinates and draw a line through these points |
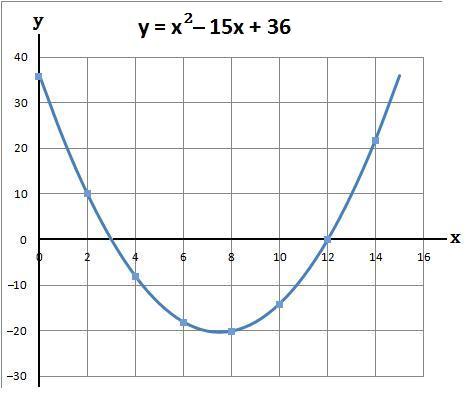
6. For the graph y = x2 − 15x + 36 when x = 0, 6 and 12. There are also the coordinates (2, 10), (4, −8), (8, −20), (10, −14) and (14, 22)
| | (a) Using a table work out the values of y |
y = x2 − 15x + 36
| | | x | 0 | 6 | 12 | | x2 | 0 | 36 | 144 | | −15x | 0 | −90 | −180 | | +36 | +36 | +36 | +36 | | y | 36 | −18 | 0 |
|
| | (b) The coordinates of the above are (0, 36), (2, 10), (4, −8), (6, −18), (8, −20), (10, −14), (12, 0) and (14, 22) |
| | (c) Plot the above coordinates and draw a line through these points |
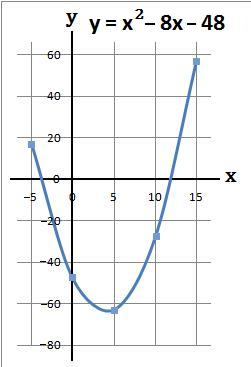
7. For the graph y = x2 − 8x − 48 when x = −5, 5 and 15. There are also the coordinates (0, −48) and (10, −28)
| | (a) Using a table work out the values of y |
y = x2 − 8x − 48
| | | x | −5 | 5 | 15 | | x2 | 25 | 25 | 225 | | −8x | +40 | −40 | −120 | | −48 | −48 | −48 | −48 | | y | 17 | −63 | 57 |
|
| | (b) The coordinates of the above are (−5, 17), (0, −48), (5, −63), (10, −28) and (15, 57) |
| | (c) Plot the above coordinates and draw a line through these points |
back to: